
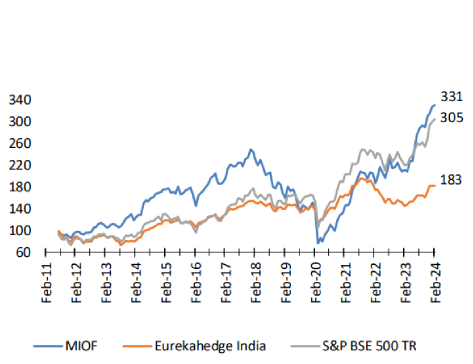
| Exhibit 2a – Metis India Opportunity Fund’s Gross Performance (USD) | |||||||
| Metis India Opportunity Fund | Nifty TR | NSE 500 TR | NSE Midcap150 TR | NSE Smallcap250 TR | Eurekahedge India (USD) | India-focused CE Funds* | |
| USD, Inception: April 2011 | |||||||
| Trailing 1 year | 2% | -11% | -7% | -1% | -2% | 15% | -20% |
| Trailing 3 years | 52% | 18% | 32% | 61% | 56% | 37% | -5% |
| Trailing 5 years | 125% | 35% | 50% | 94% | 85% | 24% | -23% |
| Since Inception TR | 236% | 160% | 205% | 439% | 289% | 110% | 15% |
| Trailing 3-year Ann. | 15% | 6% | 10% | 17% | 16% | 11% | -2% |
| Since Inception Ann. | 8% | 7% | 8% | 12% | 9% | 5% | 1% |
| Sharpe Ratio from Inception | 0.34 | 0.27 | 0.33 | 0.48 | 0.37 | 0.21 | 0.01 |
| Calmar Ratio (5-yr/3%) | 0.21 | -0.10 | 0.20 | 0.24 | 0.16 | 0.05 | -0.19 |
| Calmar Ratio (Since Inception/3%) | 0.08 | -0.11 | 0.18 | 0.19 | 0.10 | 0.08 | -0.05 |
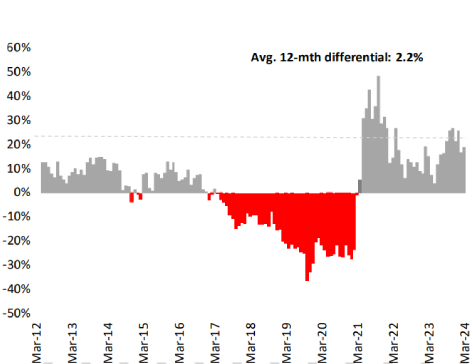
Note: *All figures are until end of April 2026; on Exhibit 1b the relative return differential is vs. S&P BSE 500 TR (USD) index. On Exhibit 2a risk-free rate of 3% was assumed for calculating Sharpe Ratio. Metis India Opportunity Fund’s (MIOF), which went live on March 11, 2014, track record was a live converted blend of our running onshore strategies (hedged at then prevailing premiums, along with benchmark indices) till March 31, 2014; India-focused close-ended funds are actively managed in US; contact manager for INR track record and GIPS compliant presentations/independent verification letter. Sources: S&P Dow Jones, Eurekahedge, Internal
Sources: S&P Dow Jones, Eurekahedge, Internal
| Exhibit 2b- Portfolio Snapshot | Exhibit 2c – GICS Sectors (# holdings) | ||
| Top 5 positions as % of book | 84% | Materials (3) | 55% |
| Avg. weighted market cap of book (million) | $1038 | Consumer Discretionary (6) | 16% |
| Avg. weighted free float of book | 52% | Financials(2) | 12% |
| Net Exposure | 100% | Industrials(1) | 15% |
| # of positions | 13 | IT(1) | 1% |
|
GIPS Compliant Composite Performance Presentations |
|||